What is volatility?
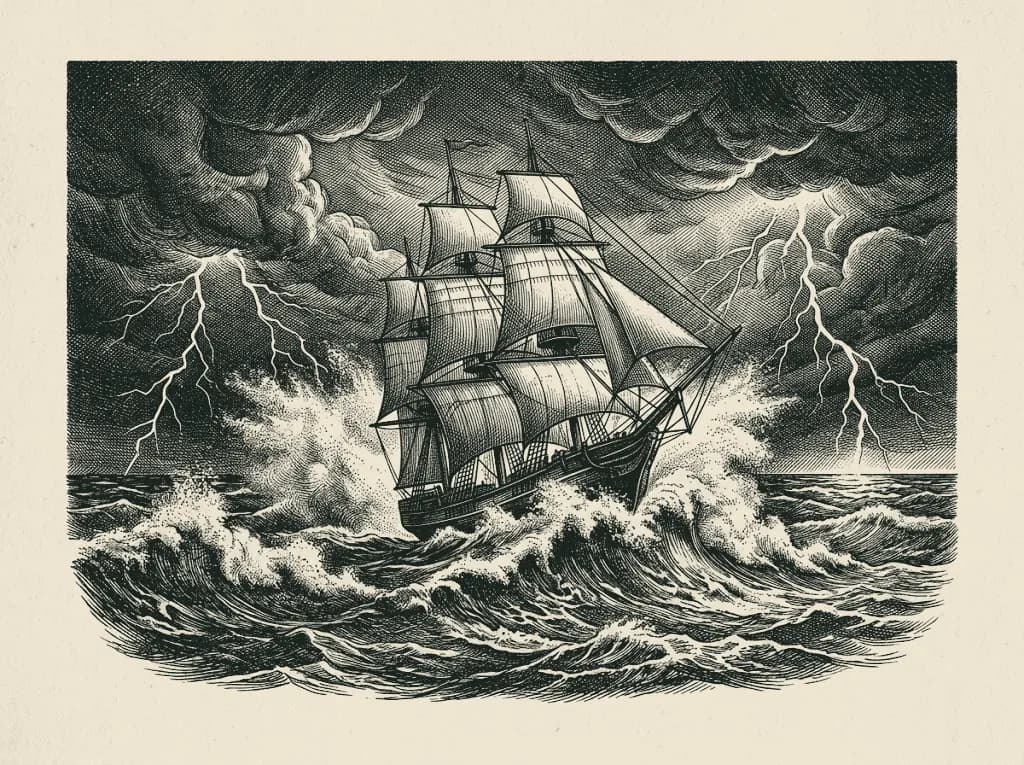
Two investments can return the same and feel completely different. Volatility measures the storm you will sail through on the way.
How to read it
A volatility of 20% a year means, roughly, that two years out of three, the return lands within 20 points of its average, above or below. Scaled down to a single session, it gives daily moves of about 1.3%. It is only an order of magnitude: markets have more extreme days than the formulas predict.
Same return, different volatility
Typical levels
| Asset | Usual annual volatility |
|---|---|
| Major index (S&P 500, CAC 40) | 15 to 20% |
| Large-company stock | 20 to 35% |
| Small company, biotech | 40% and more |
| Bitcoin | often 50 to 80% |
The VIX, the fear index
The VIX, calculated by the Chicago exchange from option prices, measures the volatility the market expects for the S&P 500 over the next thirty days. In calm times, it hovers around 12 to 20. It soars during panics.
Volatility and risk
Volatility is not a permanent loss: a very choppy index can end sharply higher. But it matters, because you may be forced to sell at the worst moment, and because a deep fall takes an even bigger rise to recover. The great crashes are the moments when it explodes.
Educational content, not investment advice.
Also worth reading
11 min read
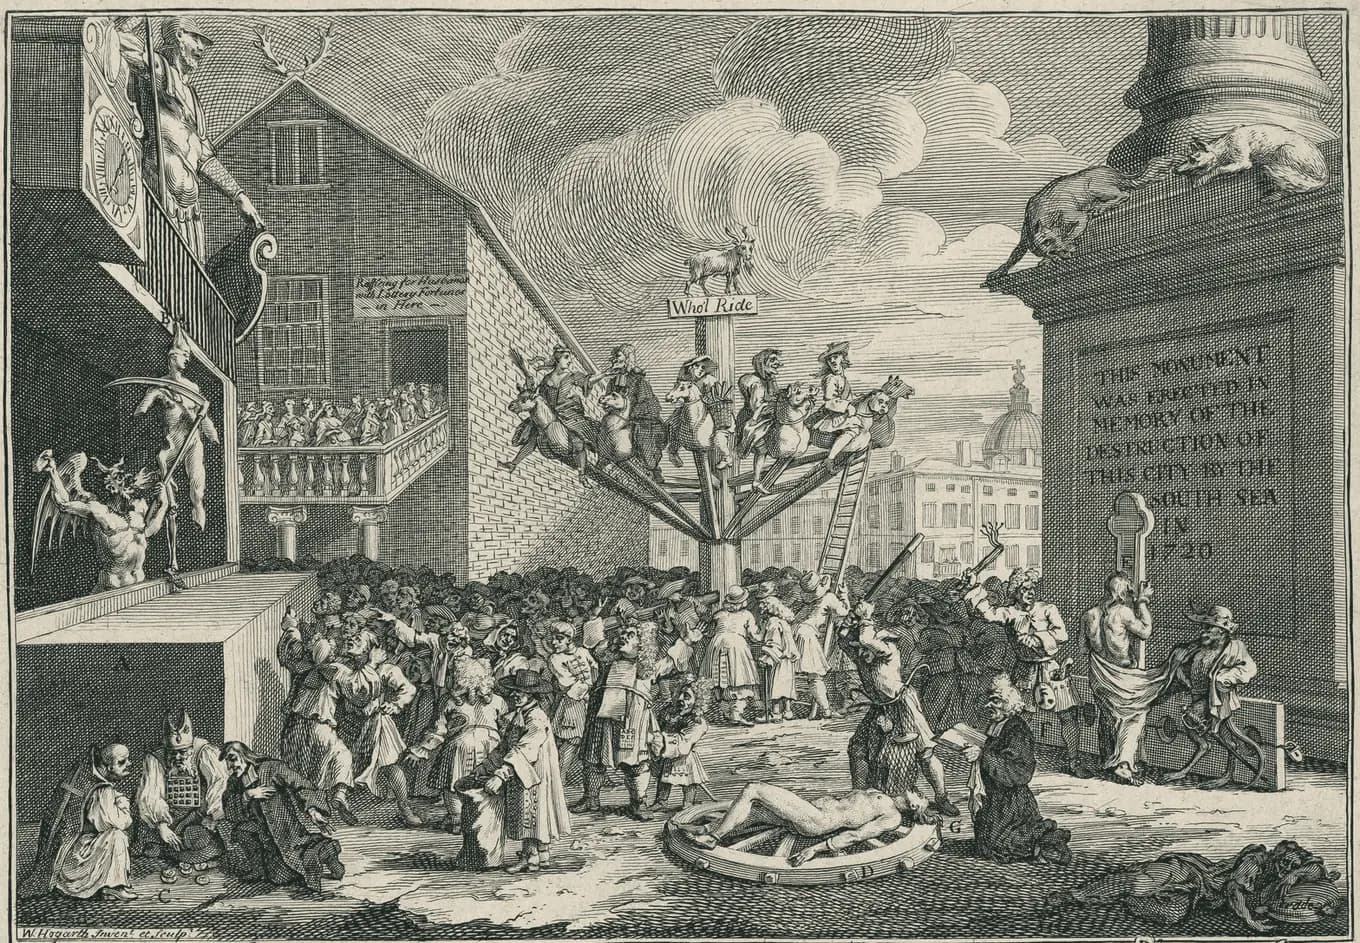
The great stock market crashes, from 1720 to 2020
Every crash looks a little like the others: euphoria, easy credit, then fear spreading faster than information. Three centuries of panics, and the lessons that remain.
Read the article →
11 min read
What to know before you start trading
Before you place your first order, a handful of concepts make all the difference between learning and losing. Here they are, without jargon, with the numbers that matter.
Read the article →
Explainer · 3 min read
What is a stock market index?
A single number to say how a market is doing. But not all indices are calculated the same way.
Read the explainer →