The great stock market crashes, from 1720 to 2020
Every crash looks a little like the others: euphoria, easy credit, then fear spreading faster than information. Three centuries of panics, and the lessons that remain.
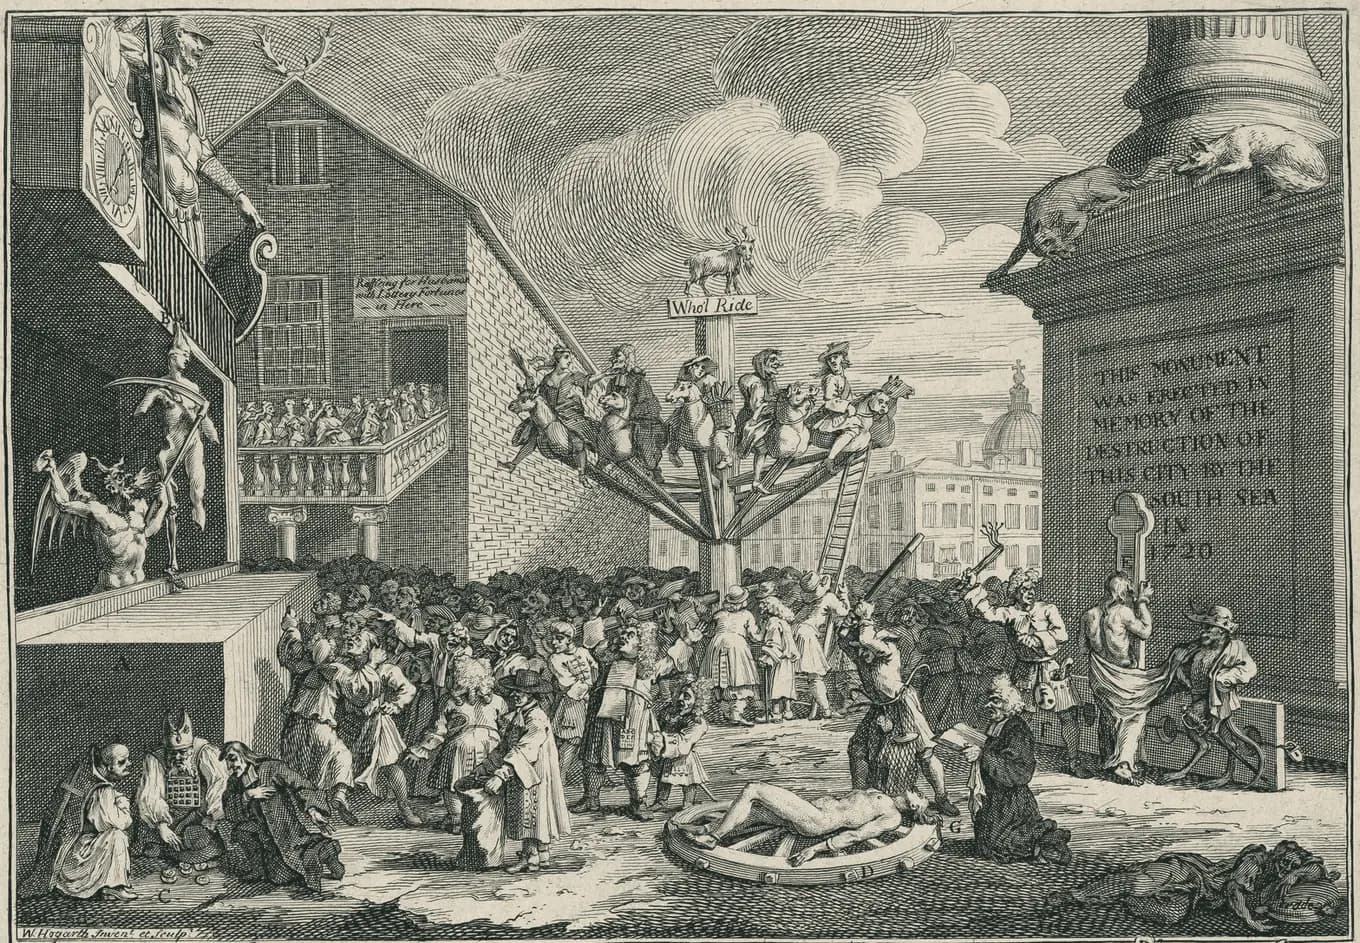
A crash is a sudden, widespread fall in prices, often of more than 20% in a few days or weeks. Each has its own causes, but almost all follow the same script: a seductive story, borrowed money to cash in on it, prices drifting away from reality, then a trigger, and fear spreading faster than information.
1720: the first bubbles
In Paris, the Scotsman John Law persuades the Regent to create a bank that issues paper money, and a company to trade with Louisiana, the Mississippi Company. Its shares, payable in the bank’s notes, rise from about 500 livres to nearly 10,000 livres in 1719. On the rue Quincampoix, people fight over them. In early 1720, the shrewdest convert their gains into gold; confidence turns, prices collapse, and Law flees France by the end of the year.
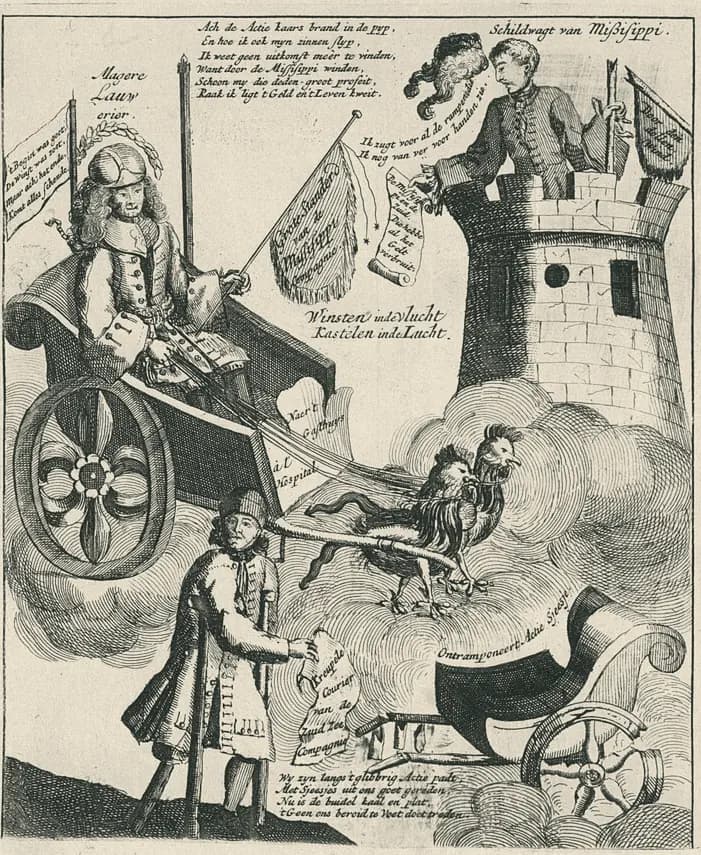
The same year in London, the South Sea Company promises fabulous profits from trade with Spanish America. Its share rises from about £130 in January to nearly £1,000 in the summer, before falling back towards £150 in the autumn. According to tradition, Isaac Newton himself lost a fortune. The engraver William Hogarth drew the plate that illustrates this article: a merry-go-round of dupes, while Honesty is broken on the wheel.
Gold and 19th-century panics
On 24 September 1869, two New York speculators, Jay Gould and James Fisk, try to corner all the available gold to drive its price up. When the US government decides to sell its reserves, the gold price collapses within minutes: Wall Street’s first “Black Friday”, which ruins many brokerage houses.

In October 1907, a failed attempt to corner the shares of a copper company triggers a run on New York’s banks. With no central bank, it is the banker John Pierpont Morgan who gathers his peers to put out the fire. The shock is so great that the United States creates the Federal Reserve six years later.
1929: the great crash
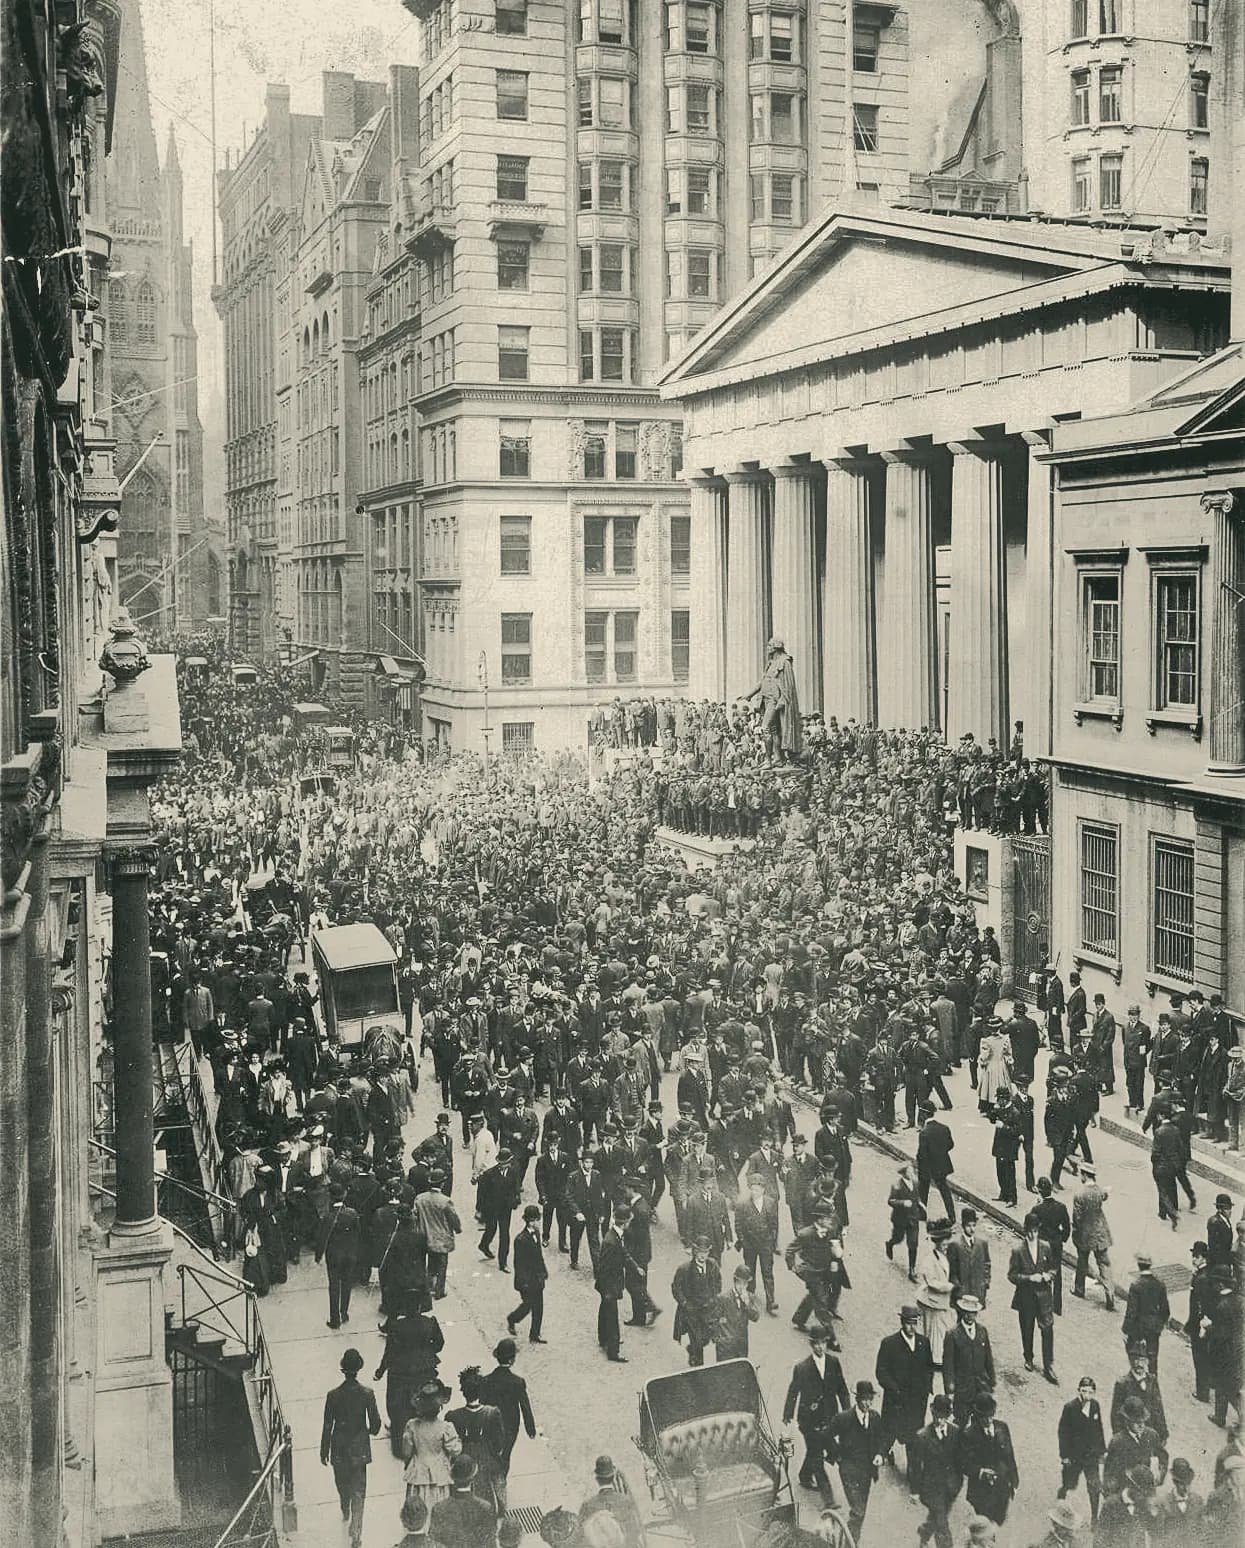
The 1920s are euphoric. People buy shares on credit, sometimes putting up only 10% of the price. The Dow Jones rises sixfold in eight years and reaches 381 points on 3 September 1929. On Thursday 24 October, panic breaks out; on Monday the 28th, the index loses nearly 13%, on Tuesday the 29th, almost 12% more. Buyers on credit, called on to repay, have to sell at any price.
The worst is yet to come. Bank failures, collapsing world trade, mass unemployment: the Dow Jones hits 41 points in July 1932, a fall of 89% from the peak.
1987: Black Monday
On Monday 19 October 1987, the Dow Jones loses 22.6% in a single session, the worst day in its history. There was no spectacular bankruptcy that day. The causes: expensive markets, rising rates, and “portfolio insurance” computer programs that sold automatically as prices fell, speeding up the slide. After this crash, exchanges introduced circuit breakers, which halt trading when prices fall too fast.
2000: the dot-com bubble
In the late 1990s, anything to do with the internet sells like hot cakes, even companies with no profit or revenue. The Nasdaq, the tech-heavy exchange, peaks at 5,048 points on 10 March 2000, then loses 78% in two and a half years. Many stars of the day disappear; a few survive and become giants. The Nasdaq only regains its peak in 2015.
2008: the financial crisis
In the United States, millions of mortgages were granted to fragile households, then sliced up and sold worldwide as complex securities. When house prices fall, nobody knows who holds the losses any more. On 15 September 2008, Lehman Brothers goes bankrupt; banks stop lending to each other. The S&P 500 loses 57% between October 2007 and March 2009.
2020: the flash crash
In February 2020, the Covid-19 epidemic reaches Europe and the United States. The S&P 500 loses 34% in just over a month, the fastest fall in its history, and circuit breakers trip four times in March. Then central banks and governments step in massively: the index is back at its peak by August. Those who sold at the bottom locked in their losses.
How long to recover
The great crashes: from peak to trough
| Crash | Fall from peak to trough | Back to the peak |
|---|---|---|
| 1929 (Dow Jones) | −89% | about 25 years |
| 1987 (Dow Jones) | −23% in one day | about 2 years |
| 2000 (Nasdaq) | −78% | about 15 years |
| 2008 (S&P 500) | −57% | about 5½ years |
| 2020 (S&P 500) | −34% | about 6 months |
These durations are based on price indices, without dividends. With dividends reinvested, recovery is shorter, but the gap between cases remains huge: a few months, or a generation.
What crashes teach us
- They come back. No era has been spared; the question is not “if” but “when”.
- Credit makes them worse. In 1720, 1929 or 2008, borrowed money is what turns a fall into a disaster, because it forces people to sell at the worst moment.
- Diversification limits the damage. Those who had bet everything on internet stocks in 2000 waited fifteen years; a spread-out portfolio recovered much faster.
- Selling in a panic is costly. The best sessions often come right after the worst. Missing them is enough to damage a performance for good.
- Volatility is part of the journey. Better to know in advance how much volatility you can stand than to find out in the middle of the storm.
If you think prices will fall, there is also short selling, a powerful but dangerous tool. The game’s The bank run scenario drops you into a recent banking panic: a good way to test your reflexes.
Educational content, not investment advice.
Also worth reading

Explainer · 3 min read
What is volatility?
Two investments can return the same and feel completely different. Volatility measures the storm you will sail through on the way.
Read the explainer →
11 min read
What to know before you start trading
Before you place your first order, a handful of concepts make all the difference between learning and losing. Here they are, without jargon, with the numbers that matter.
Read the article →
Explainer · 2 min read
Short selling in 2 minutes
Making money when the price falls: it is possible, but the risk changes shape. The mechanism in four steps.
Read the explainer →