Micro-trading algorithms, explained simply
A large share of orders on stock markets comes from algorithms that decide in a few microseconds. How do they make money, and what do they change for everyone else?
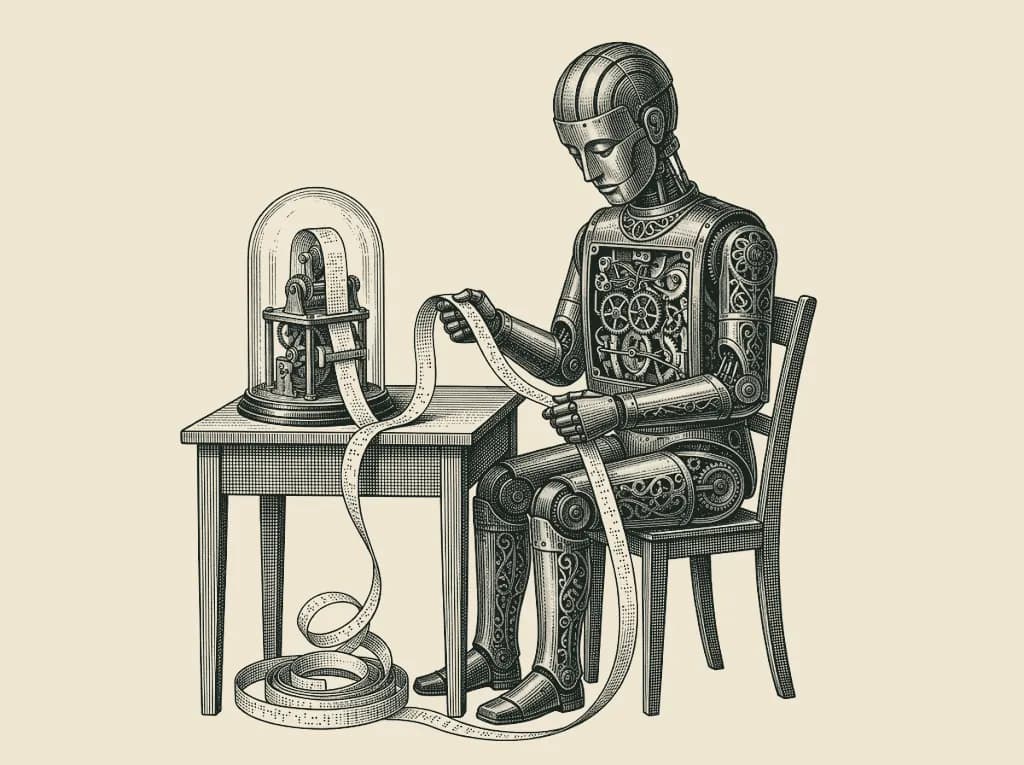
Micro-trading refers to strategies that place a huge number of orders, over very short periods, to earn a tiny amount each time. These orders are decided and sent by algorithms, in a few microseconds, without human intervention. In the United States, this high-frequency trading is estimated to account for around half of stock trading volume.
What are we talking about?
The term covers several things that are worth telling apart.
- Algorithmic trading: any order decided or executed by a program. A fund that automatically splits a large order into small pieces counts, even if it holds the shares for years.
- High-frequency trading (HFT): an extreme form of the former, where speed is the main edge. Positions last from a few milliseconds to a few minutes, and are almost always closed before the end of the day.
- Scalping: the “human” version of the idea, taking very small, repeated gains. Done by individuals, it works on the scale of seconds or minutes, not microseconds.
The race to the microsecond
For these strategies, getting there first is everything. The delay between the moment information appears and the moment the order reaches the exchange is called latency, and trading firms spend fortunes to reduce it.
Co-location
Exchanges rent out space in their own data centres, a few metres from the computers that match orders. Every metre of cable counts: light travels about 20 centimetres per nanosecond in optical fibre. Serious operators even equalise cable lengths between clients, so that nobody gains an edge from where they sit in the room.
Links between markets
In 2010, a company dug an almost straight fibre-optic line between Chicago, where futures are traded, and the New York area, where stocks are traded. Estimated cost: around 300 million dollars, to shave a few milliseconds off the round trip, down to about 13. A few years later, networks of microwave towers beat it: in air, signals travel about half as fast again as light in glass, and the round trip dropped to around 8 milliseconds.
| Delay | Order of magnitude |
|---|---|
| Human reaction | 200,000 µs (0.2 s) |
| Retail internet connection to an exchange | 10,000 to 50,000 µs |
| Chicago – New York round trip by microwave | about 8,000 µs |
| Decision by a co-located algorithm | a few µs |
From seconds to microseconds
To go even lower, the fastest algorithms no longer run on ordinary processors, but on programmable chips (FPGAs) that react directly to the data arriving from the network.
The main families of strategies
Market making
This is the most common strategy. The market maker constantly displays a buying price and a slightly higher selling price. Every time a buyer and a seller go through it, it pockets the gap, the spread: often a fraction of a cent per share, multiplied by millions of trades. Its main risk: piling up shares just before the price falls, against someone better informed.
Statistical arbitrage
Some assets usually move together: two large companies in the same sector, an index and its components, an exchange-traded fund and its basket. When the gap between them strays from its usual level, the algorithm sells the more expensive one, buys the cheaper one, and waits for the gap to close. The bet is not risk-free: a gap can also reflect a real change.
Latency arbitrage
The same stock trades on several platforms. When its price moves on one, the others take a few microseconds to follow. The fastest algorithm can buy where the price has not yet risen, just before it does. This is the most controversial strategy, because it profits from a technical delay rather than from analysis.
Very short-term momentum and news reading
Other programs spot imbalances in the order book, or analyse newswires and official releases in a few microseconds, to position themselves in the direction of the move that is starting.
Algorithmic execution
This is not high-frequency trading, but it is a close cousin. A fund that needs to buy millions of shares cannot do it in one go without pushing the price up against itself. Its algorithms therefore split the order: in equal slices over time (TWAP, time-weighted average price) or following the day’s usual volumes (VWAP, volume-weighted average price).
The market maker
What these algorithms change for everyone else
The verdict is mixed. On the one hand, competition between electronic market makers has sharply narrowed spreads on large stocks: buying or selling costs far less than in the days of open-outcry trading floors. On the other, this liquidity can vanish all at once, just when it is needed most.
The report by US authorities identified a trigger: a very large sell order of S&P 500 futures, about 4 billion dollars, handed to an execution algorithm that sold regardless of price. High-frequency algorithms first absorbed these sales, then traded the contracts back and forth among themselves, before pulling out en masse. In 2016, a British trader also pleaded guilty to manipulation by spoofing (placing orders with no intention of executing them), a practice accused of making the fall worse.
An algorithm can also go wrong on its own. On 1 August 2012, badly deployed software at Knight Capital, one of the largest US market makers, sent millions of unintended orders: about 440 million dollars lost in 45 minutes. The firm had to be taken over.
Rules have tightened since. In Europe, the MiFID II directive has required high-frequency traders since 2018 to be authorised, to test their algorithms, to be able to switch them off instantly and to keep records of their orders. Exchanges automatically halt trading in a stock whose price runs out of control.
Can you do micro-trading at home?
Not in the true sense. An individual starts with a delay of several tens of milliseconds, thousands of times more than co-located players: at that scale, they always arrive after everyone else. Three more obstacles stand in the way:
- Fees: an average gain of a fraction of a cent per share never covers retail brokerage fees.
- Data: complete, fast market data feeds are expensive, and free data arrives late.
- Overfitting: a strategy tested on the past can look miraculous simply because it was tuned, unknowingly, to the random quirks of that particular period.
Platforms promising winning “trading robots” to install at home therefore deserve the utmost suspicion.
What a player can take away
Without aiming for the microsecond, algorithmic trading firms practise a discipline that any investor can learn from.
- Rules written in advance: when to enter, when to exit, how much to commit.
- A loss limit per position and per day, respected without exception.
- Testing the rules on historical data, while distrusting results that look too good.
- Tracking costs: fees and spreads often turn a gain into a loss.
- An order journal, reread with a cool head to understand what worked, and what did not.
This is exactly what a simulator on historical prices is for. In PastFolio, you apply your rules one session at a time, without knowing what comes next, and see what they produce on the real market of the time, fees included.
Educational content, not investment advice.
Also worth reading

11 min read
What to know before you start trading
Before you place your first order, a handful of concepts make all the difference between learning and losing. Here they are, without jargon, with the numbers that matter.
Read the article →
Explainer · 3 min read
What is volatility?
Two investments can return the same and feel completely different. Volatility measures the storm you will sail through on the way.
Read the explainer →Explainer · 3 min read
What is a stock market index?
A single number to say how a market is doing. But not all indices are calculated the same way.
Read the explainer →